Three years ago, the University of the Sciences in Philadelphia was at a crossroads with its constituent relationship management system. The system it was using at the time, based on Unidata, was decades old, said Necie Steward, director of advancement services for USciences.
The provider was planning to upgrade the system to a newer version, which would have required no small upheaval within the various departments that used it.
As it happened, most of the users hated the system and welcomed the opportunity for a complete change.
“Getting assistance and help was complicated — we had to call the vendor itself or hire consultants,” Steward explained to CRM Buyer. “Also, it wasn’t very user friendly — it was based on a mnemonic system, so the users had to know the various screen names to get the most use out of it.”
It wasn’t hard for Steward’s IT services staff to navigate, she said, but it was frustrating for university staff that occasionally used it to, say, view a profile of a prospective donor.
“Also, there weren’t links between spouses’ or children’s records. It just wasn’t easy or intuitive to use,” she said.
USciences picked Sage Millennium, a CRM application aimed at large nonprofit organizations, which is based on relationship trees and a comprehensive donor database.
$450,000 Later
Other features include event management, campaign management, society membership management, online giving, planned giving reporting, and analysis and document management.
USciences spent a total about US$450,000 on the implementation, Steward said — an amount that included integration costs, the software license, and additional consulting work to prep the data from the old system.
“There were additional costs for us because we were using Unidata,” Steward said. “That meant we had to preconvert to SQL in order to convert to Millennium. We had to hire people to pull data out so they could SQL-ize it and send to Sage.”
It went live in August 2010. Users loved it, she reported. “It is intuitive, user-friendly. People do not have to turn to IT services at every point just to do a simple command.”
Next Step, Analytics
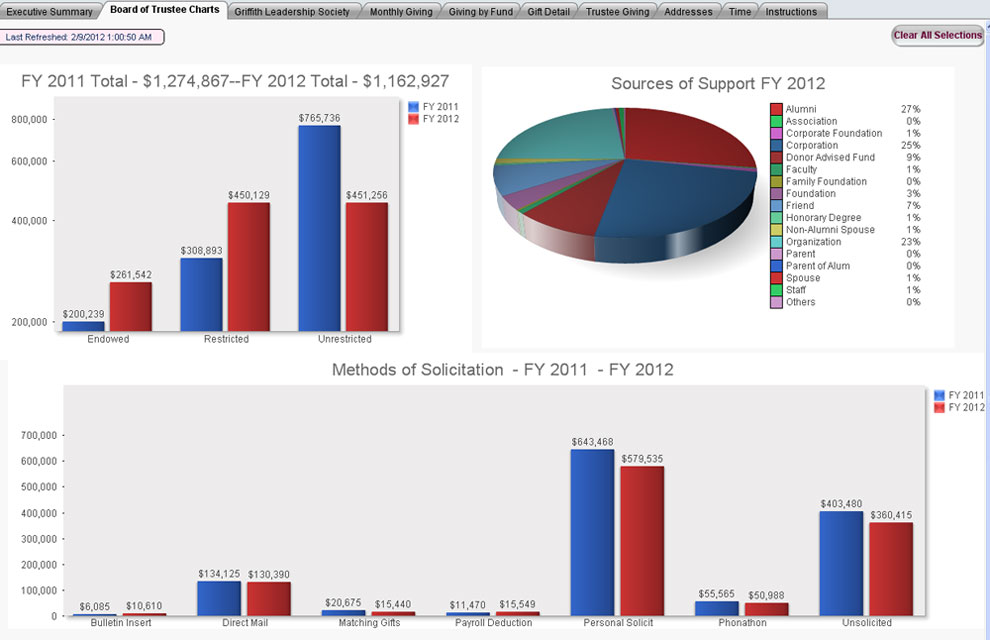
USciences just finished deploying the advanced reporting and analysis functionality, Visual Analyzer, which wasn’t available when it first implemented the system, Steward said.
It keeps a running tally, via high-level charts and other visual gauges, of where the university is year-to-date with its goals. Executives at the university appreciate that it updates every night, without requiring input from IT, noted Steward.
“Before we implemented Visual Analyzer, we were pulling all the data into an Excel file and creating that chart or graph,” she said.
Another nice feature is Visual Analyzer’s click-through functionality, remarked Steward. All it takes is a click on a link to access a spreadsheet revealing the data behind the chart.