When Microsoft's next service update to Microsoft Dynamics CRM is released in Q2 2012, users who rely on its business intelligence functionality will be in for a pleasant surprise.
Microsoft has ratcheted up the BI functionality significantly, providing more options on how to view, present and interact with the data, Craig Dewar, director of Microsoft Dynamics CRM, told CRM Buyer.
"We think this will be an important competitive differentiator for us in the CRM space," he said.
To be precise, the new BI functionality will be embedded in SQL server, on which the CRM application runs. Users access it via the CRM app.
Already a Rich Environment
The new functionality will build on -- or rather, supersede -- what is already a rich analytical environment, Dewar said.
"Right now, we offer a number of different standard dashboards that can be customized by users," he explained. "These dashboards are interactive -- giving, say, a sales manager the ability to click through any portion of a pipeline funnel to get a better sense of the data underneath.
Immersive Canvas
The forthcoming enhancements put this functionality on steroids, said Dewar. "We have created a rich immersive canvas for users to interact with the data."
For instance, the app can connect a series of related dashboards -- say of a particular product pipeline -- so that when one element is adjusted, all of the dashboards automatically reflect the change. "That is one new rich element -- the ability to slice and dice multiple screens by prebuilt quadrants," Dewar noted.
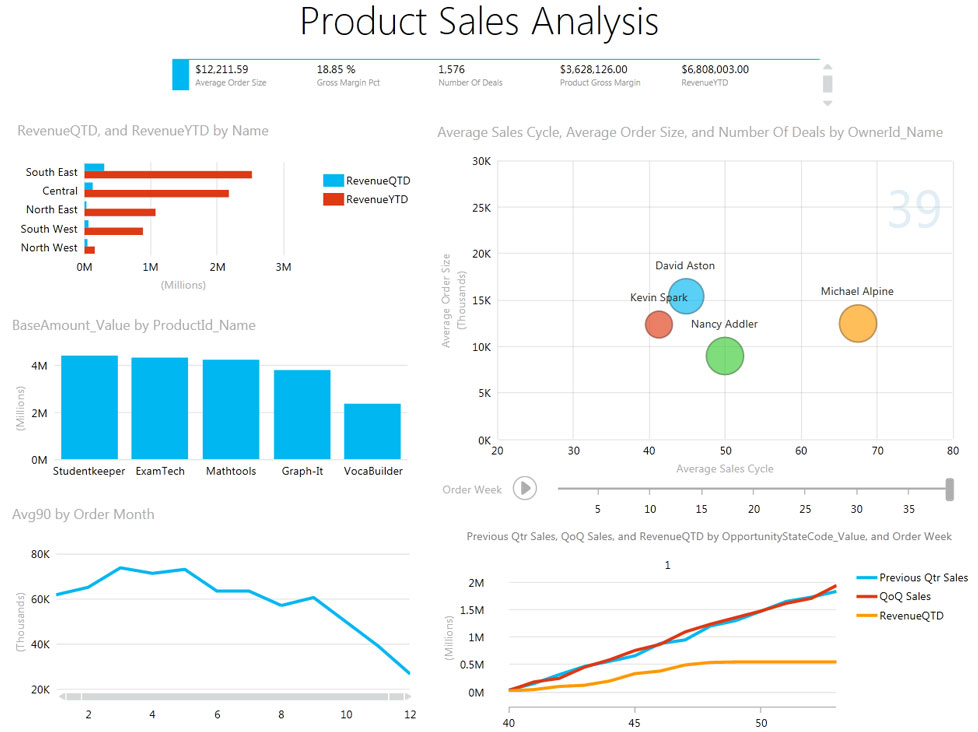
Another feature shows how a dashboard would change over time via a slider bar underneath the chart.
The view presented to the user is an animated one, with bubbles and other graphical renderings. Click on the start button, and the bubbles and so on move within the report to show changes happening over weeks or months.
This is a handy option for meetings, said Dewar.
Tangible Results
For example, say a sales manager is speaking with a rep who may not be performing to expectations. By being able to illustrate his progress to date -- and what his current activity means for future progress -- the rep can get a clearer sense of where he must improve.
"That can be a hard thing to figure out with static tables and charts," Dewar pointed out. "Trends don't jump out at you the same way they do when their visualization moves across the screen."
This BI functionality is part of all four main workflows supported in the CRM app: customer care, sales, marketing, and social media outreach. "What we tried to do is make this data alive for people," said Dewar, "and an essential part of the tools that they use every day."