Company performance relies on how well a company is led, how engaged its employees are, and the quality of the technology at hand, which effectively means the tools employees can leverage. Certainly, there are metrics for all of this. But the trouble with metrics is that they are collected and administered by management which has a vested interest in the outcome of any survey.
Beagle Research Group took a different approach in a recent research project sponsored by Zoho Corporation. During the winter of 2020, Beagle asked rank-and-file employees what they thought. Beagle's specific interest was to better understand employee engagement. To be complete, Beagle also asked about management from the employee perspective and technology.
What Beagle found gratifying was that the professionalism of employees and the executives running their companies was quite good. Somewhat surprising was the opinion of employees about the technology systems they work with day to day.
Beagle's conclusion is that to improve corporate performance today, one should first examine the quality of the technology used to run companies and face customers.
How Beagle came to those conclusions is an interesting story.
During the COVID winter, Beagle surveyed 509 individuals from across America and Canada. These individuals were specifically selected because they were line-of-business people and not managers. These people largely had customer-facing jobs.
Questions were grouped in three buckets:
- Employee Engagement
- Alignment and Competence
- Technology
Engagement and technology are self-evident. Alignment and competence reflect how employees gauge their ability to align with company goals and their impression of how well their bosses convey company needs from the jobs.
Scoring the Results
Most of the survey questions were asked as ratings on a scale of one to five, with an answer of three being neutral. In most cases, the ratings are related to these sentiments.
- Completely Disagree
- Disagree
- Neutral
- Agree
- Completely Agree
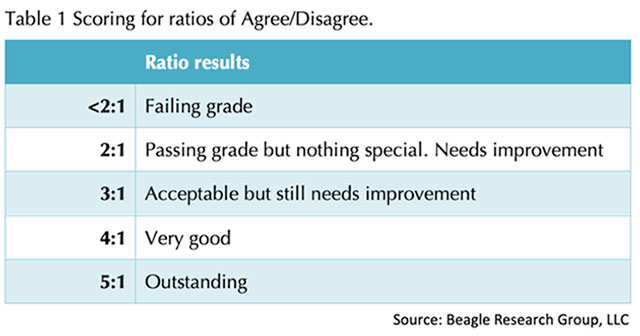
In all cases, Beagle grouped the percentages (not the numeric values of the options) of 1 and 2, as well as 4 and 5, giving scores for Disagree and Agree, which were then added together and divided to find the ratios of Agree/Disagree which they view as important metrics.
For example, this statement: "I have high satisfaction in the work I do."
The results were 63 percent agreement, 13 percent disagreement, and 21 percent neutral. Importantly, the ratio of 5.2 (agree/disagree) represents a relatively high consensus for the group since most of the survey takers took a stand, with only 21 percent reporting as neutral.
This was the basis of scoring.
It's important to note, however, that not all answers were as cut and dried. In another example, when asked to rate company leadership, 42 percent rated theirs exceptional or good; only 19 percent said theirs was poor or not good, and 39 percent remained neutral.
The high number of noncommittal answers gave no real majority, but still provided a usable ratio. In this case, the rating ratio of just over 2:1, which falls into the needs improvement category which is categorized in the table below.
This scoring system presented Beagle with the big question of what to do with the answers in the middle, neutrals who refused to fish or cut bait. Neutrals were a big issue precisely because as the questions got more difficult, more people decided not to decide.
For example, for questions about rating their own employee engagement, the average neutral score was 23.2 and the ratio was 5.8:1 (outstanding); for questions about alignment and competency, the average for neutrals went to 28 with an average ratio of 3:1 (acceptable, but needs improvement); and for technology, the average for neutrals was 29 and the average ratio was 1.97, technically a failing grade but which rounds up to 2.0 and needs improvement.
Despite the survey being completely confidential, it seems that people were reluctant to say what they thought (and how could people have no opinion of such a vital part of their jobs?).
Beagle decided the neutrals provided vital insight because there was an inverse relationship between neutrals and positive scores. Simply put, high ratios had low numbers of neutrals, and they didn't view that as an accident but as mutual reinforcement.
The scoring system is somewhat reminiscent of the Net Promoter Score (NPS), in which scores of 7 and 8 on a scale of 0 to 10 are discarded. The zero through 6 scores are tallied and subtracted from the total of the nines and tens, leaving users with the net.
Conclusions
It all comes down to this. Professionalism is high in the ranks. Most employees like their jobs and are happy to do them. Moreover, they think their bosses are good. Bosses communicate effectively and are fair in their dealings.
Things break down over technology, though. Half of the panel thinks the technologies they work with are good, which Beagle suggests is low. Also, only single-digit results accrue for questions about whether employees have access to systems that recommend the next best actions and voice recognition, two things indicative of advanced customer-facing tools.
Almost one-third (29 percent) of the panel had no opinion of their technology, which Beagle found high given the amount of time employees spend interfacing with technology each day. As mentioned above, technology gets a barely passing grade using this scoring method.
The inescapable conclusion is that businesses across North America are well-led and staffed with people who are engaged in their work. However, technology is barely adequate, and because of this, managers should devote their attention to improving systems whenever they think about improving overall company performance.
If you'd like to play "what if" with the data, go here.
About the Survey
The results come from 509 individual contributors culled equally from many industries and company sizes. Zoho Corporation paid for the study, and Beagle Research Group, LLC is solely responsible for the analysis and results.