
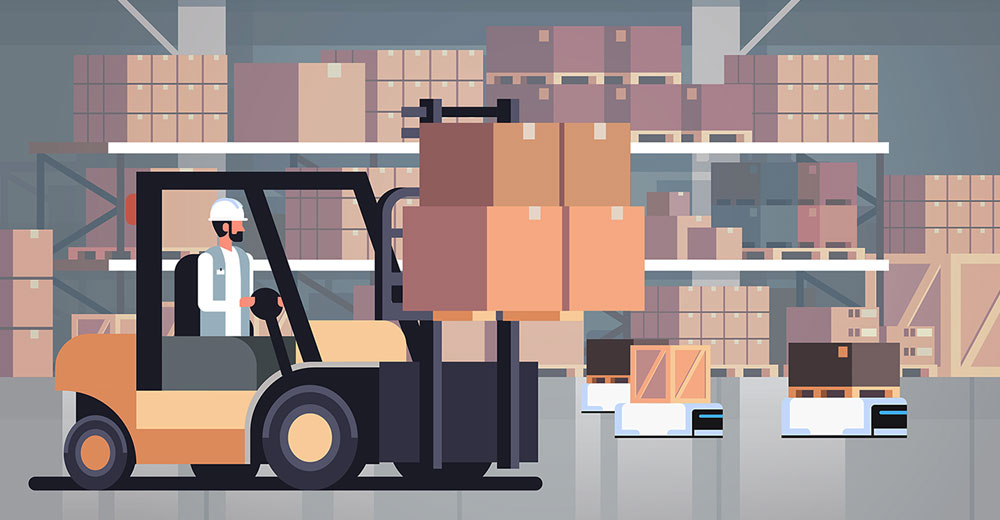
Consumer packaged goods, or CPG, are the everyday items consumers use, such as food, beverages, clothes and household products. These products are ones that require regular replacement or replenishing. Due to the frequency of purchases and the low cost of switching brands, this market is extremely competitive.
E-commerce is now a popular channel through which consumers are purchasing these types of products. With the level of competition, businesses need to find ways to get ahead and stay on top.
All business decisions center around getting the best return on investment. Typically, a sales manager is tasked with determining the best ways to allocate the time and resources of the sales team for the best ROI. However, CPG sales largely rely on field merchandising or marketing reps who work remotely, scattered throughout different territories.
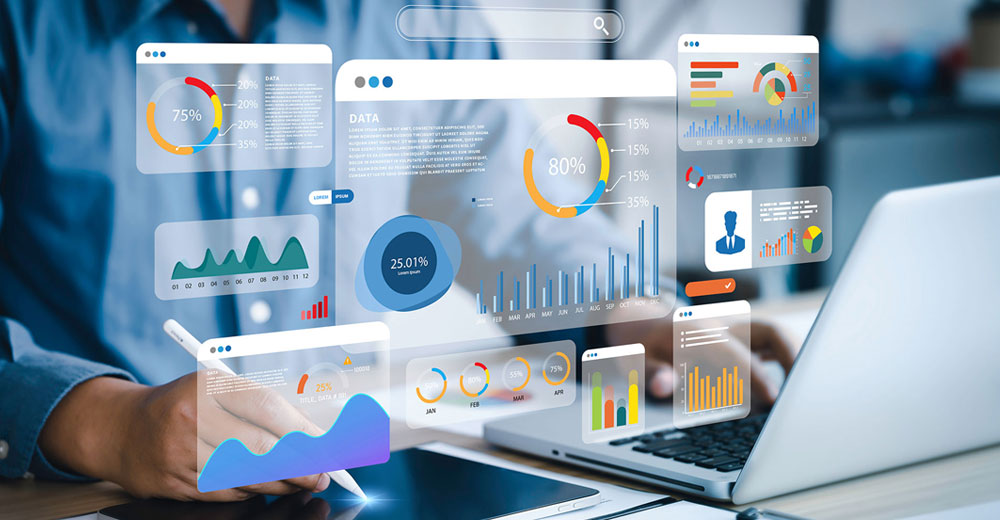
Field sales brings with it different variables that aren’t as prevalent in traditional inside sales roles — such as traffic, weather and various market conditions. However, with all the time reps spend out in the field, and the different variables they face, there is an opportunity to gather data. Field sales data can be extremely beneficial if you can collect and centralize it.
Too often companies make decisions around their products with very little information on the individuality of each market they are selling in. The emergence of technologies to support analytics is changing things by making data analysis much more attainable. Companies are able to gather and analyze data around the different markets they sell to, which is key to making smarter business decisions and getting ahead.
Three critical field sales data metrics can take CPG sales to the next level.
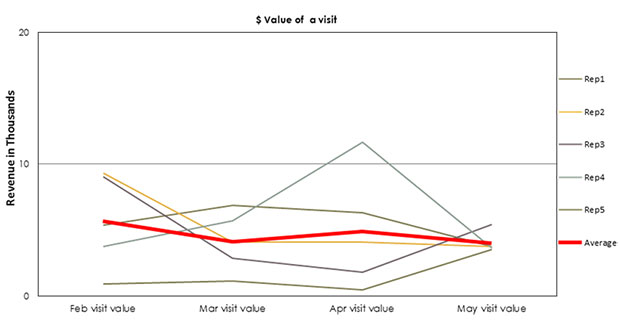
1. The Value of a Single Visit
As it is one of the most important key performance indicators, it’s a serious wonder that so many sales managers are unable to answer the very important question: “What’s the value of a visit?”
I can’t stress the importance of knowing this account KPI. Determining this metric sets the stage for a lot of other decisions. For example, you’ll know where to prioritize your travels when in a limited-time scenario — which is always!
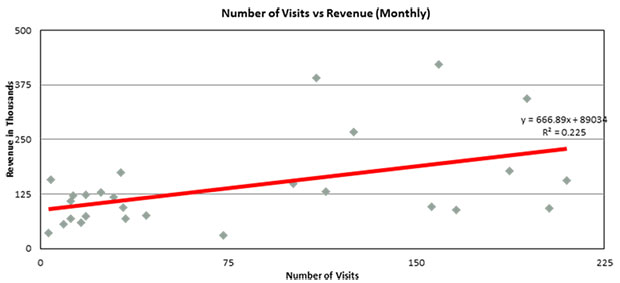
2. Visit Cadence and Revenue Output Correlations
Tracking your rep’s location visits is much more about the activities themselves than it is tracking their locations — and your reps need to know that! Actively recording their visit whereabouts and cadence provides foundational data that can be used to understand a visit’s impact on revenue output and other performance output metrics.
Combining location revenue output with visit activities and running correlation analysis will provide insights into which visits have the type of impact on location revenue that your company is hoping for.
After running this type of analysis, it appears that there is no correlation between visits and revenue generated out of a particular location, intelligent sales professionals should begin to consider shifting their attention elsewhere.
It is important to mention that in making this type of determination, one also should consider the type of visit being made. Certain visit types can be more impactful than others (i.e. demonstration events, product training/educational events, general account checkups). Recording the type of event that has occurred is essential in finding correlation coefficients associated with visit types.
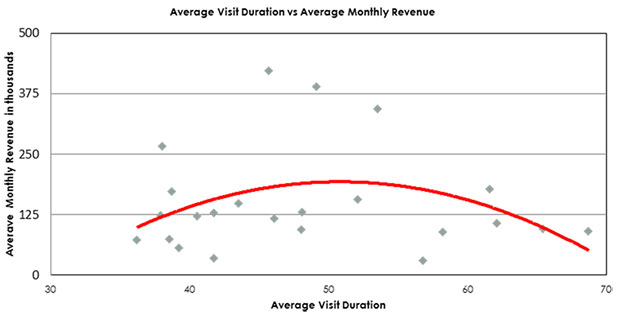
3. Visit Duration
Thirty minutes? An hour? Three hours? Reps often have some flex in determining how long they will tend to an account. However, uncertainty about the appropriate amount of time to designate for a visit is coming to an end — and it should be, considering today’s available technology.
Accurately tracking the amount of time a rep spends on location combined with performance output data of said location lends itself to an incredible insight metric: the inflection point where the law of diminishing returns starts.
This metric is important because it informs sales professionals of the optimal amount of time to spend on location before ROI starts to depreciate, allowing them to reduce costs and head to other accounts.
Whether in field sales, marketing or merchandising, sales professionals should expand their level of thinking as it relates to sales operations and execution. The available technology provides a platform for deeper thinking around performance, strategy and execution.
In a world where the CPG space is being impacted significantly by the “Amazon Effect,” brands have to become smarter and more efficient in order to remain competitive.


Social CRM
See all Social CRM